How would you spend $500K to improve our city & environment?

Cambridge has allocated $500,000 for implementing citizen ideas as part of its Participatory Budget initiative. The projects must be capital projects on city property that benefit the public. Submit some climate resiliency, energy efficiency, or renewable energy ideas!

Brainstorming welcome. Check out the site below and share your ideas. Yes, that means you!

http://cambridgema.nationbuilder.com/

Save the Dates! Upcoming Environmental Events

There’s a ton of great stuff to put on your calendar this month and next…

PARK(ing) Day is September 19 – The City of Cambridge will transform parking spaces into something more surprising for a day. It’s a great time to learn what the city is up to, meet your neighbors, and have some fun. CEA will be in Central Square, come say hi! (And pick up some swag!)

You can also find us at the Danehy Park Family Day! September 20 @ 11:00PM.

Join the City of Cambridge for this invigorating panel discussion “Getting towards Net Zero” at the Cambridge Main Library on September 23 @6:00PM. See: Invitation4_9_4_2014 for more details. Hosted by the City of Cambridge’s Net Zero Task Force.

Interested in what’s new in building energy efficiency? Take a tour of Bostons’ LEED Silver Hosteling International building on September 25 @ 5:30PM.

What’s yet another great way to save money and be kind to the environment? Fixing your broken stuff! But don’t worry if you’re not the handy type, just come to Repair Cafe. Experts will be available to help you take on your fix-it projects big and small (for free!). September 27 @10:00AM, 5 Callendar Street, Cambridge.

Learn about the hazards of methane leaks and what HEET’s Squeaky Leak program is doing about them. Natural Gas Forum on Tuesday, September 30th @ 6:00PM

Do you know of a non-profit that owns their building? Refer them to the Race to Solar program, which can help them go solar on the cheap to save big on energy costs. Details at the HEET Race to Solar Workshop @ 12:30PM, October 2, in Jamaica Plain or 4:00PM, Octber 8 in Cambridge.

We hope to see you at one or more of these fantastic local events! Follow us on Twitter for information on events like these, plus local and national energy efficiency and renewables news.


We’re hiring! Energy Assistant Planner

We’re seeking a full-time Energy Assistant Planner for this 2-year contract position. Details below. See the original posting here.

ESSENTIAL DUTIES AND RESPONSIBILITIES:

The Energy Assistant Planner will assist with and manage a variety of energy outreach and planning activities, program analysis and data tracking, with a focus on community and stakeholder engagement in energy efficiency and renewable energy. This person will be a member of an eleven person team within the Environmental and Transportation Planning division of the Community Development Department, doing innovative and collaborative work with other city departments with a focus on renters, landlords, homeowners, businesses, schools, higher education institutions, community groups, non-profits and the local utility company and also including regional, state and federal energy agencies.

Primary responsibilities will be in three main areas:

Multi-Family Residential Energy Efficiency Pilot is a program currently being designed with MIT and the local utility (NSTAR) to try and overcome barriers to deploying energy efficiency in multi-family housing including: the split incentive problem, condominium common ownership challenges and financing issues. The Pilot will require collaborative work with NSTAR, community and business organization, residents, and energy efficiency contractors. Tasks include:

  • Coordinate Multi-family Pilot programming, resources and communication.
  • Track and analyze program results.
  • Create Multi-Family Pilot marketing and outreach materials for print, web, and social media.
  • Facilitate and organize outreach events, workshops, and meetings with residential property owners
  • Track participation in a CRM system (Salesforce).
  • Build coalitions and working relationships with lenders, contractors, and tenant/landlord organizations.
  • Perform other duties as required.

Georgetown University Energy Prize (GUEP) is a national competition for small to medium sized municipalities to see who can reduce their energy use in the municipal and residential sector the most from 2015-2017 in order to win a $5 million dollar prize.  GUEP tasks include:

  • Research and model the energy savings that could be achieved with innovative energy campaigns.
  • Execute innovation energy campaigns to drive down residential energy use through efficiency and renewable energy adoption.
  • Work with K-12 public schools on energy education and energy savings projects for school and home.
  • Coordinate with other city departments on driving down municipal energy use.
  • Manage quarterly GUEP reporting process and writing reports and press releases documenting progress.
  • Create marketing and outreach materials for print, web, and social media.
  • Recruit volunteers and community leaders to support the GUEP effort.
  • Perform other duties as required.

Solar Market Pathways is a U.S. Department of Energy grant that the City of Cambridge and Boston applied for to develop a ten year solar deployment plan for our cities/region. Solar Market Pathways tasks include:

  • Contribute to a stakeholder engagement process, including identifying and recruiting stakeholders and attending stakeholder meetings.
  • Assist with a market segmentation data collection and analysis.
  • Contribute to research on solar deployment programs in other cities and countries including policies, programs, financing, etc.
  • Attend and report on the activities of a regional solar committee.
  • Contribute to efforts to address solar deployment in sectors like rental housing, new construction, and utility area networks.
  • Contribute to reporting and documenting Solar Market Pathways progress.
  • Perform other duties as required.

MINIMUM REQUIREMENTS:

The Energy Assistant Planner should be familiar with energy efficiency and renewable energy technology, policy and community organizing, and data tracking and analysis.  Technical experience should include a basic understanding of energy efficiency and renewable energy equipment.  Ability to work with a wide variety of people, coordinate projects, and use diplomacy required.  Should possess excellent project management, organizational, communication, presentation, computer, writing and analytical skills.  Minimum of two years of related professional experience and a related Bachelor’s degree.

 Qualifications

  • Strong interpersonal and time management skills, and ability to multi-task while remaining organized
  • Must be able to work independently, as a proactive team player
  • Ability to explain technical information to lay audiences and comfortable with public speaking
  • Experience building community partnerships and relationships
  • Experience with campaign planning and community organizing
  • Knowledge of the Cambridge community
  • Understanding of energy efficiency and renewable energy technology and policy, especially Massachusetts policy and the Mass Save program a plus.
  • Understanding of utilities, especially deregulated utilities and utility energy efficiency programs.
  • Flexibility to work nights and weekends for events (as needed)
  • Excellent written and oral communication skills
  • Volunteer recruitment, supervision, and training experience
  • Desire to work with K-12 schools.

PHYSICAL DEMANDS:  Requires travel to and through the City and adjacent cities. Driving, walking, biking, bending, squatting, reaching and standing for long periods.  Reasonable accommodations may be made to enable individuals with disabilities to perform essential functions.

WORK ENVIRONMENT:  Work involved is both indoor in a profession office setting and outdoors for outreach opportunities.

RATE: $52,650/year + excellent benefits

APPLICATION PROCEDURE:

Internal applicants submit a job bidding form and 2 copies of both your resume and letter of interest; external applicants submit both your resume and letter of interest by 5pm on the closing date via email to employment@cambridgema.gov or Personnel Dept, Room 309, City Hall, 795 Massachusetts Avenue, Cambridge MA 02139.  Fax 617-349-4312

Cambridge advances to the next round of the Georgetown University Energy Prize  

The City of Cambridge is one step  closer to $5 million for our energy efficiency efforts. On Thursday,  August 7, the Georgetown University Energy Prize announced 52 quarterfinalists that will advance to the next round in the two-year competition for a $5 million grand prize, and we’re on the list! Read the announcement here.

The prize will be awarded to the community the demonstrates the most effective and innovative ways to reduce energy consumption. To learn more about the competition, see www.guep.org

Stay tuned for updates on our progress! Interested in getting involved? Email Meghan Shaw at outreach@cambridgeenergyalliance.org

First-Ever Energy Star Label for Clothes Dryers Now Available

The EPA has announced a brand new energy efficiency certification for clothes dryers under the Energy Star label. As known energy hogs, the potential savings are big: if all residential clothes dryers sold in the U.S. meet these new requirements, the utility cost savings will grow to more than $1.5 billion each year and more than 22 billion pounds of annual greenhouse gas emissions would be prevented.

Over 80% of U.S. homes have a clothes dryer, which on average account for approximately six percent of residential electricity consumption. In order to reduce dryers’ energy use by over 20% of the minimum 2015 standards, Energy Star dryers will incorporate technologies such as:

  • Auto termination sensors
  • Heat pumps to recapture lost hot air
  • Performance data and alerts
  • Smart grid readiness

Explains U.S. EPA Administrator Gina McCarthy: “Working with industry on innovative approaches to address our changing climate, we are helping consumers select more energy efficient appliances, save money and reduce greenhouse gas emissions.”

Read more about this news from the EPA newsroom.


We’re hiring! Community Outreach Coordinator

Do you have a passion for energy issues and community engagement?  Do you want to share that passion by training and inspiring high school interns to reach out to the Cambridge community about energy efficiency, clean energy and other sustainability issues?  Check out our summer Community Outreach Coordinator position!


Position Summary

The Community Outreach Coordinator Intern (COC) will support the City of Cambridge’s – Cambridge Energy Alliance community energy efficiency program.  The COC will help administer an energy efficiency and solar community canvass and manage high school student intern canvassers that will educate Cambridge residents about energy efficiency, renewable energy, and connect the community to existing energy efficiency services.  The COC will work closely with the Outreach Director to shape and run a summer outreach program for six high school student interns. The COC will help teach the high school interns community engagement skills like canvassing, creating outreach materials, administering surveys, interacting with the public and analyzing data all while educating them about energy efficiency, solar energy and other sustainability issues. COC will also help the students gain skills in personal organization, goal setting, and public speaking.

For more information on the Alliance, see www.cambridgeenergyalliance.org.


Roles & Responsibilities

Coordinating a community canvass and managing canvassers by:

  • Working with Outreach Director to shape summer outreach program
  • Managing paid high school interns
  • Training interns in canvassing techniques
  • Creating canvass materials including training materials, outreach materials, and maps
  • Collecting, managing, and analyzing the canvass data

Supporting community outreach activities by:

  • Organizing and representing CEA at events
  • Promoting and maintaining the CEA website, Warm Home Cool Planet blog, social media
  • Working on additional projects that promote energy efficiency and clean energy in the Cambridge community


Skills & Qualifications

CEA seeks a person with strong community organizing and/or social marketing experience with some knowledge about the technical and policy issues around energy efficiency and clean energy. A strong desire to work with and inspire high school students is preferred. Due to the short-term nature of this position and the limited time to engage the high school student interns, the ability to be flexible and quickly turn plans into actions is important. The works hours are 8:30am-5:30pm Monday-Friday.


Tenure and Compensation

Starting Date:  ASAP (as early as 6/16/14)

Ending Date:  08/31/14 unless extended by Department

Duration: 2.5 months total unless extended by Department

Hours:  Full-time (40 hours per week, not including holidays)

Compensation: $14.71 /hour


To Apply

Submit a resume and brief cover letter to the email below. Include your desired start date.  No phone calls please.

Contact:   Meghan Shaw, Outreach Director

Address:  344 Broadway, Cambridge, MA 02139

Phone:     (617) 349-5323

Email:       outreach@cambridgeenergyalliance.org


Energy, Solar, Sustainability, Bikes, Housing – The Cambridge Master Plan Needs You

Cambridge is stepping forward into a city-wide master plan process!

The first step in this master planning process is Cambridge Conversations, a series of listening sessions to be held in different neighborhoods across the city during June 2014.   These conversations will help shape the master plan process as we move from listening to working together to develop a shared framework, and from there to a plan and action.  Here is your opportunity to share your ideas about what is working well, what could work better, and what kind of city we want – today and in the future.

Cambridge Conversations will kick off with a series of three community meetings.  Join us at a location and time that works for you.

  • Tuesday, June 10, 6:30-8:30 PM:  Tobin School Gym, 197 Vassal Lane
  • Wednesday, June 11, 6:30-8:30 PM:  Kennedy School Cafeteria, 158 Spring Street
  • Saturday, June 14, 10:00 AM-12:00 noon:  Cambridge College, 1000 Massachusetts Avenue, 1st floor

Additionally, informal drop-in sessions are being scheduled in multiple locations around Cambridge.  Stop by and see us.

  • Monday, June 16, 11:00 AM-1:00 PM:  Windsor Street Health Center Lobby, 119 Windsor St
  • Thursday, June 26, 4:00-7:00 PM:  Citywide Senior Center, 806 Massachusetts Ave
  • … more to come


We will also be available at several community events and public meetings over the summer so look for the Community Conversations table at

  • Cambridge Bicycle Network Plan Open House: Thursday, June 12, 5:00 PM-8:30 PM – Cambridge Main Library, 449 Broadway
  • Kendall Square Farmers Market: Wednesday, June 18, 11:00 AM-1:00 PM – Main Street sidewalk at Kendall Station
  • Alewife Public Meeting (City Council Transportation & Public Utilities Committee): Thursday, June 19, 6:00-8:00 PM — Tobin School Lobby, 197 Vassal Lane
  • …more to come

Coming Soon:

  • Over the next couple of weeks we will be setting up a coUrbanize site to continue the conversation online.

We look forward to hearing your thoughts in person or online.

* If you’d like us to come to a meeting of your neighborhood or other group for a smaller discussion, please send us an email (ifarooq@cambridgema.gov).  We’d be happy to attend.

* If you received this message through a listserv or a friend and would like to join the notification list for Cambridge Conversations:  Citywide Master Plan, please send us an email.

* Please feel free to forward this notice to others who might be interested.

‘Finding a language’..Research cont: Facts and Figures

This blog post follows up on a post from December, 2o13.

Key Findings:

The chart below shows the total CO2 emissions from the consumption of energy  and the per capita CO2 emissions of US, China and India in the years 2006 and 2011.

 Total CO2 emissions from the consumption of energy (million metric tons) 2006Total CO2 emissions from the consumption of energy (million metric tons)2011Per capita CO2 emissions (tons) 2006Per capita CO2 emissions (tons) 2011 
US5823549019.7817.62
CHINA653387154.586.52
INDIA149417251.161.45

The study of these nations reveals various scenarios which represent diverse uses of energy. These further helps in studying the wasteful behaviors of households and identifying the measures to be taken.

The chart points towards the high CO2 emissions in both categories in a developed country like US.

The populations of developing countries such as India and China are adapting at a very fast pace toward an urban lifestyle.

From 2006 to 2011, the emissions seem to reduce in US and increase in India and China.
Picture1

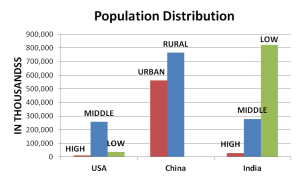
Chart above: The population breakdown compared across US, China and India. High, middle, and low refers to income groups.

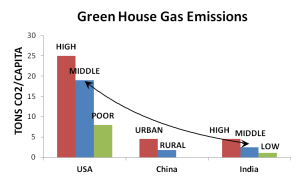
Chart below: GHG emissions across the three countries.
Picture2

The charts above show the population distribution in US, China and India. The comparison shows:

  • The high-income people have the lowest populations and the highest contribution to emissions.
  • The developing countries need carbon space for the large chunk of low-income population to develop.
  • The average North American generates about 20 tons of CO2-eq each year. The global average carbon footprint is about 4 tons of CO2-eq per year. (Walser, 2010)

It is easier to understand the statistics across the globe if we individually look at what creates that carbon footprint!

Following are some facts about the three countries:

India:

The findings plainly illustrate that the considerably high carbon footprint of a relatively small wealthy class (1% of the population) in the country is camouflaged by the 1.1 billion poor population of the country, who keep the overall per capita emissions below 2 tonnes of CO2 per year.

While even the richest income class in this study, earning more than 30,000 rupees a month, produce slightly less than the global average CO2 emissions of 5 tonnes, this amount already exceeds a sustainable global average CO2 emissions of 2.5 tonnes per capita that needs to be reached to limit global warming below 2 degrees centigrade.” (G. Ananthapadmanabhan, 2007)

A very small percentage of the population (high income) was actually hiding behind the 80% of the population in terms of their carbon footprint.

China:

Acknowledging the significant regional differences in China, we select five very divergent provinces as case studies, situated in the east (Shanghai), south (Guangdong), centre (Henan), north (Heilongjiang) and west (Gansu).” (Kuishuang Feng, 2009).

People’s lifestyles in rural areas of Shanghai were much different from other areas. Differences due to higher housing prices, in the case of Shanghai or higher expenditure shares on clothing in the colder regions continued to exist. The basic difference between rural and urban China: almost 3 times the carbon emissions in urban China over rural China.

It was very rare to have electrical appliances in rural China in 1985, while in 2002 coverage of electrification had increased dramatically to 32% for washing machines, 14% for refrigerators, and 60% for color TV sets.

The purchase of washing machines doubled in 2002 as compared to 1985 in urban China. Color TVs are now present in most urban households and over half of rural households.

The number of refrigerators increased by 10 times between 1985 and 1995, and climbed by another 30% between 1995 and 2002.

USA:

No distinctions made on the income group or a region since there is a large middle class which exists across the country.

Housing accounts for almost one-third of consumer-spending, while the remaining four categories, namely transport, food, goods and services are somewhat evenly split.

The expenditure is more towards housing whereas transport contributes to emissions the most.

The break-up of the end-use electricity consumption shows a large contribution of kitchen appliances (which includes vampire loads). The next in row are air-conditioning, space heating and lighting.

The chart below shows a comparison between all the three scenarios:

 USA avg.India avg.3k-8k8k-15k15k-30kChina avg.
Per capita emissions (million metric tons)

911

142.2

256.3

Typical household size

2.6

Urban-4.1 Rural -4.3Rural-4.5 Urban-3.2
Typical household emissions (metric tons)

2368.6

Rural-611.46 Urban-583

495

535

868.5

Rural-1153.3 Urban- 820.16
BreakdownTransportOver 200

66.33

152.5

221.5

The chart affirms the fact that the average values of a country are elusive. What is clear is the need to find strategies to shift behavior to reduce emissions in all parts of the world, especially developed countries and those countries that are rapidly developing.


Bibliography:

G. Ananthapadmanabhan, K. S. (2007). Hiding Behind the Poor. Bangalore: Greenpeace India Society.

Kuishuang Feng, K. H. (2009). Lifestyles, technology and CO2 emissions in China: A regional comparative analysis. Elsevier , 145–154.

Walser, M. L. (2010, 07 2010). carbon footprint. Retrieved 07 25, 2010, from eoearth.org: http://www.eoearth.org/article/Carbon_footprint

‘Finding a language’ to educate people on ways to reduce carbon emissions through their lifestyle.

I come from a country (India) where a power cut in peak hours every day in summers is a regular phenomenon. Water tankers in neighborhoods after 3 days of water shortage is not something new.
This country (US) welcomes me with a flood of fluorescent lights and a dense network of roads. Apart from watering the plants, I drink the same water I have a bath with. Strange, people do not switch off any lights in their stores or air-conditioners sometimes when they leave home or their workplaces for long hours.
The increasing energy consumption has given rise to climate change which is considered as the largest threat to humanity. Globally temperatures have already increased by 1.5 -2 degrees centigrade over the past century (G. Ananthapadmanabhan, 2007). They are further expected to increase by.
Climate change is man made. The globe is heating due to the emission of Green House Gas Emissions, the most prominent being carbon dioxide produced by burning fuels.
The energy consumption of an individual varies by factors such as region, climatic conditions, and means of transport, his work environment and his personal habits.

The percentage of energy consumed by the richest fifth of the world (20%) amounts to 60%, by the rest of the world (80%): 40% and by the U.S.: 25% (G. Ananthapadmanabhan, 2007)

According to various studies done, United States being one of the most developed nations, leads the world in this context.

Foot

Few astonishing facts:

Residential energy is alone responsible for 21% of total energy consumption (Jones, 2005). On average, people in the U.S. spend over 90% of their time indoors. (Wallace, 1987) Thus it becomes very essential to bring a change in the lifestyles of people to reduce this damage to the environment.

The average North American generates about 20 tons of CO2-eq each year. The global average carbon footprint is about 4 tons of CO2-eq per year. (Walser, 2010)

The per capita carbon footprint ( in 2006) of US being 911 metric tons of CO2, China 256.3 and India being 142 (G. Ananthapadmanabhan, 2007), this figure seems a little odd due to the similarities in the energy patterns amongst the users. Thus the study of these nations reveals various scenarios which diversify the uses of energy. These further helps in studying the wasteful behaviors of households and diversify the measures to be taken.

The following posts will discuss the existing trends in US, China and India and suggest methods to spread sustainability and suggest ways in which information can play a role in the context of education and bring in the social changes.


Bibliography:

G. Ananthapadmanabhan, K. S. (2007). Hiding Behind the Poor. Bangalore: Greenpeace India Society.

Jones, C. M. (2005). A Lifecycle Assessment of U.S. Household Consumption: The Methodology and Inspiration behind the “Consumer Footprint Calculator”. Breslauer Symposium. Berkeley: University of California International and Area Studies.

Wallace, L. A. (1987). The Total Exposure Assessment Methodology Study. Washington DC : U.S. Environmental Protection Agency.

Walser, M. L. (2010, 07 2010). carbon footprint. Retrieved 07 25, 2010, from eoearth.org: http://www.eoearth.org/article/Carbon_footprint

Sareena