Solar Co-ops: Another Way to Go Solar

On Earth Day, the Rocky Mountain Insitute  reminded us of an effective tool for solar development: the solar co-operative. Like any co-operative, solar co-ops pool the resources of many in order to increase purchasing power, increase access to benefits, and create other efficiencies. Businesses and/or individual consumers band together to collectively purchase solar photovoltaic (PV) panels and share knowledge about best practices. Here are a few kinds of solar co-operatives that are relevant to Cambridge residents.

Community Solar

One type of co-operative concept called community solar can help bring solar to those who typically wouldn’t have access to it, such as renters or any households without enough rooftop sun exposure. Community solar allows customers to buy into an off-site system and receive credits on their utility bills. Customers can purchase as much or as little solar energy as they want, and they don’t have to worry about installation or maintenance.  The Clean Energy Collective  was one of the first organizations to establish this model and they now operate multiple solar gardens throughout the US.

Residential Solar Co-op

The Mt. Pleasant Solar Cooperative offers another model for co-operative solar, as the Washington, D.C. area neighborhood group has organized over 300 households in order to purchase solar PV panels in bulk. This has reduced installation costs for households getting PV panels and has ultimately brought more solar power into the community than would have otherwise been the case. In addition to increasing the affordability of solar, the co-op network fostered a supportive atmosphere that diminished other barriers to solar energy. Says Mt. Pleasant solar system owner Louise Meyer: “I felt like I was part of a team, it made much more sense, you could compare notes and not feel so stranded. It was such a new area for many people, and the paperwork is such a hassle, being part of the cooperative made it so much easier.”

The Mt. Pleasant model has spurred the creation of other neighborhood solar co-ops in the region as well. Several of the neighborhood groups are further organized under the umbrella organization DC SUN, which advocates for solar energy and serves as a regional resource for anyone interested in solar.

Conclusion

The solar co-op model is a promising tool to increase solar energy development in a range of contexts. With its variety of housing types and large multifamily housing stock, we see co-operative solar as a viable solution for Cambridge. What do you think? Would one of these models work for you?

About this Blog Post

This blog post summarizes information from a Rocky Mountain Institute blog post. You can read the original article here:  http://blog.rmi.org/blog_2014_04_22_the_rise_of_solar_coops

The City of Cambridge Pledges to Compete for $5M Georgetown University Energy Prize

Across the country, the demand for energy is rising rapidly.  Yet, despite known negative implications for our environment, we still allow more than half of the total energy produced in the U.S. to go wasted due to inefficiencies. [1]

The City of Cambridge wants to help change this, and as part of our commitment to environmental sustainability, energy efficiency, and climate change action, we have pledged our intent to compete in the $5 million Georgetown University Energy Prize.

The Prize kicked off at a two-day conference in Washington, D.C. on April 23, 2014. At the event—which officially opened the competition’s Application Phase— The City of Cambridge was announced as one of more than 50 communities who have signed letters of intent to compete for the Prize. Meghan Shaw, the Community Outreach Director for the Cambridge Energy Alliance, attended the launch of the competition—there she is in the Indian Treaty Room of the White House, fifth from left in the middle row, with other competitors:

GEUPlarger

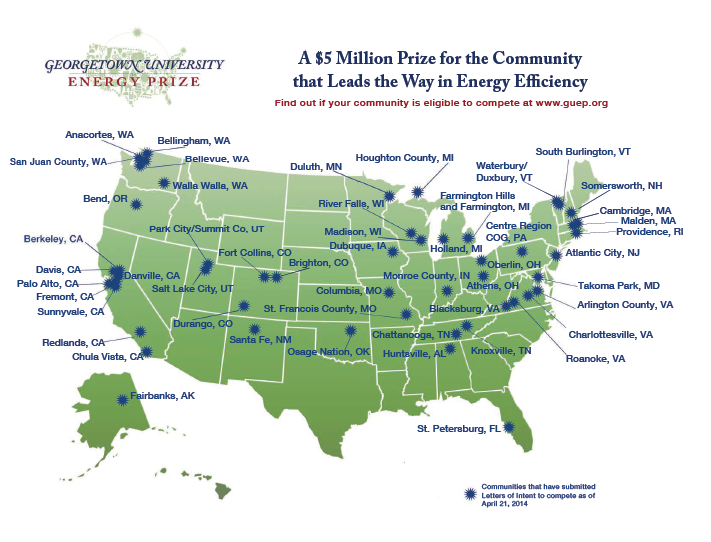
As a competing community, we join other small- to medium-size towns, cities, and counties that will develop and implement creative, sustainable, and replicable strategies to save energy. Here’s a map of the other communities that have also pledged to compete:

guep map

During the current Application Phase, we will work collaboratively with local stakeholders to develop an energy-saving plan that will not only deliver financial benefits to residents, but will also help ensure the long-term sustainability of our community. Most importantly, we aim to design a plan that other communities can replicate—so that we can all do our part to increase our nation’s energy independence.

The Application Phase—which ends on June 30, 2014—will be followed by Quarterfinals, and Semifinals, and will conclude in 2017 when one winning community is awarded a $5 million prize purse for use on energy efficiency programs. More information about each of the competition’s four stages is available at www.guep.org/rules-timeline.

Stay tuned for more details on the Prize, the City of Cambridge’s energy-saving plan, and to learn how you can support our efforts. In the meantime, please stay connected with us through this blog, our Facebook page, and Twitter @CambEnergy.

We are excited to get underway in the competition and we look forward to elevating the City of Cambridge as a national leader of energy efficiency efforts in America.

Help us get there! For questions about the Prize or if you would like to get involved in the effort, please contact Meghan Shaw at outreach@cambridgeenergyalliance.org.


[1] According to the Lawrence Livermore National Laboratory, using Department of Energy/Energy Information Administration data from August 2010, out of all energy produced, the U.S. has an energy efficiency rate of 42 percent, which means 58 percent of all the energy we produce is wasted: www.llnl.gov/news/newsreleases/2010/images/energy-flow-annotated.pdf.


‘Finding a language’..Research cont: Facts and Figures

This blog post follows up on a post from December, 2o13.

Key Findings:

The chart below shows the total CO2 emissions from the consumption of energy  and the per capita CO2 emissions of US, China and India in the years 2006 and 2011.

 Total CO2 emissions from the consumption of energy (million metric tons) 2006Total CO2 emissions from the consumption of energy (million metric tons)2011Per capita CO2 emissions (tons) 2006Per capita CO2 emissions (tons) 2011 
US5823549019.7817.62
CHINA653387154.586.52
INDIA149417251.161.45

The study of these nations reveals various scenarios which represent diverse uses of energy. These further helps in studying the wasteful behaviors of households and identifying the measures to be taken.

The chart points towards the high CO2 emissions in both categories in a developed country like US.

The populations of developing countries such as India and China are adapting at a very fast pace toward an urban lifestyle.

From 2006 to 2011, the emissions seem to reduce in US and increase in India and China.

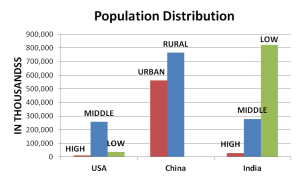
Picture1

Chart above: The population breakdown compared across US, China and India. High, middle, and low refers to income groups.

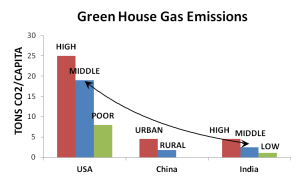
Chart below: GHG emissions across the three countries.

Picture2

The charts above show the population distribution in US, China and India. The comparison shows:

  • The high-income people have the lowest populations and the highest contribution to emissions.
  • The developing countries need carbon space for the large chunk of low-income population to develop.
  • The average North American generates about 20 tons of CO2-eq each year. The global average carbon footprint is about 4 tons of CO2-eq per year. (Walser, 2010)

It is easier to understand the statistics across the globe if we individually look at what creates that carbon footprint!

Following are some facts about the three countries:

India:

The findings plainly illustrate that the considerably high carbon footprint of a relatively small wealthy class (1% of the population) in the country is camouflaged by the 1.1 billion poor population of the country, who keep the overall per capita emissions below 2 tonnes of CO2 per year.

While even the richest income class in this study, earning more than 30,000 rupees a month, produce slightly less than the global average CO2 emissions of 5 tonnes, this amount already exceeds a sustainable global average CO2 emissions of 2.5 tonnes per capita that needs to be reached to limit global warming below 2 degrees centigrade.” (G. Ananthapadmanabhan, 2007)

A very small percentage of the population (high income) was actually hiding behind the 80% of the population in terms of their carbon footprint.

China:

Acknowledging the significant regional differences in China, we select five very divergent provinces as case studies, situated in the east (Shanghai), south (Guangdong), centre (Henan), north (Heilongjiang) and west (Gansu).” (Kuishuang Feng, 2009).

People’s lifestyles in rural areas of Shanghai were much different from other areas. Differences due to higher housing prices, in the case of Shanghai or higher expenditure shares on clothing in the colder regions continued to exist. The basic difference between rural and urban China: almost 3 times the carbon emissions in urban China over rural China.

It was very rare to have electrical appliances in rural China in 1985, while in 2002 coverage of electrification had increased dramatically to 32% for washing machines, 14% for refrigerators, and 60% for color TV sets.

The purchase of washing machines doubled in 2002 as compared to 1985 in urban China. Color TVs are now present in most urban households and over half of rural households.

The number of refrigerators increased by 10 times between 1985 and 1995, and climbed by another 30% between 1995 and 2002.

USA:

No distinctions made on the income group or a region since there is a large middle class which exists across the country.

Housing accounts for almost one-third of consumer-spending, while the remaining four categories, namely transport, food, goods and services are somewhat evenly split.

The expenditure is more towards housing whereas transport contributes to emissions the most.

The break-up of the end-use electricity consumption shows a large contribution of kitchen appliances (which includes vampire loads). The next in row are air-conditioning, space heating and lighting.

The chart below shows a comparison between all the three scenarios:

 USA avg.India avg.3k-8k8k-15k15k-30kChina avg.
Per capita emissions (million metric tons)

911

142.2

256.3

Typical household size

2.6

Urban-4.1 Rural -4.3Rural-4.5 Urban-3.2
Typical household emissions (metric tons)

2368.6

Rural-611.46 Urban-583

495

535

868.5

Rural-1153.3 Urban- 820.16
BreakdownTransportOver 200

66.33

152.5

221.5

The chart affirms the fact that the average values of a country are elusive. What is clear is the need to find strategies to shift behavior to reduce emissions in all parts of the world, especially developed countries and those countries that are rapidly developing.


Bibliography:

G. Ananthapadmanabhan, K. S. (2007). Hiding Behind the Poor. Bangalore: Greenpeace India Society.

Kuishuang Feng, K. H. (2009). Lifestyles, technology and CO2 emissions in China: A regional comparative analysis. Elsevier , 145–154.

Walser, M. L. (2010, 07 2010). carbon footprint. Retrieved 07 25, 2010, from eoearth.org: http://www.eoearth.org/article/Carbon_footprint

‘Finding a language’ to educate people on ways to reduce carbon emissions through their lifestyle.

I come from a country (India) where a power cut in peak hours every day in summers is a regular phenomenon. Water tankers in neighborhoods after 3 days of water shortage is not something new.
This country (US) welcomes me with a flood of fluorescent lights and a dense network of roads. Apart from watering the plants, I drink the same water I have a bath with. Strange, people do not switch off any lights in their stores or air-conditioners sometimes when they leave home or their workplaces for long hours.
The increasing energy consumption has given rise to climate change which is considered as the largest threat to humanity. Globally temperatures have already increased by 1.5 -2 degrees centigrade over the past century (G. Ananthapadmanabhan, 2007). They are further expected to increase by.
Climate change is man made. The globe is heating due to the emission of Green House Gas Emissions, the most prominent being carbon dioxide produced by burning fuels.
The energy consumption of an individual varies by factors such as region, climatic conditions, and means of transport, his work environment and his personal habits.

The percentage of energy consumed by the richest fifth of the world (20%) amounts to 60%, by the rest of the world (80%): 40% and by the U.S.: 25% (G. Ananthapadmanabhan, 2007)

According to various studies done, United States being one of the most developed nations, leads the world in this context.

Foot

Few astonishing facts:

Residential energy is alone responsible for 21% of total energy consumption (Jones, 2005). On average, people in the U.S. spend over 90% of their time indoors. (Wallace, 1987) Thus it becomes very essential to bring a change in the lifestyles of people to reduce this damage to the environment.

The average North American generates about 20 tons of CO2-eq each year. The global average carbon footprint is about 4 tons of CO2-eq per year. (Walser, 2010)

The per capita carbon footprint ( in 2006) of US being 911 metric tons of CO2, China 256.3 and India being 142 (G. Ananthapadmanabhan, 2007), this figure seems a little odd due to the similarities in the energy patterns amongst the users. Thus the study of these nations reveals various scenarios which diversify the uses of energy. These further helps in studying the wasteful behaviors of households and diversify the measures to be taken.

The following posts will discuss the existing trends in US, China and India and suggest methods to spread sustainability and suggest ways in which information can play a role in the context of education and bring in the social changes.


Bibliography:

G. Ananthapadmanabhan, K. S. (2007). Hiding Behind the Poor. Bangalore: Greenpeace India Society.

Jones, C. M. (2005). A Lifecycle Assessment of U.S. Household Consumption: The Methodology and Inspiration behind the “Consumer Footprint Calculator”. Breslauer Symposium. Berkeley: University of California International and Area Studies.

Wallace, L. A. (1987). The Total Exposure Assessment Methodology Study. Washington DC : U.S. Environmental Protection Agency.

Walser, M. L. (2010, 07 2010). carbon footprint. Retrieved 07 25, 2010, from eoearth.org: http://www.eoearth.org/article/Carbon_footprint

Sareena

Winter is coming – these books will keep you warm and save you money!

It’s nippy out there. Here are some books and e-books we recommend for DIY energy upgrades you can do before it really gets cold. Find a project that works for you and get started on it soon – you’ll thank yourself when you are toasty warm and saving money all winter long!

For homeowners:

Insulate and Weatherize by Bruce Harley ($19.95) – A primer on insulation and other weatherization techniques. This title is for anyone looking to insulate their home, either by themselves or by hiring someone.

Cut Your Energy Bills Now by Bruce Harley ($12.95) – Hard to argue with that title. Mr. Harley presents 150 ways to make your home more comfortable (for you and for the planet).

For renters and homeowners:

The Honest Book of Home Energy Savings: Energy Efficency for New England by HEET (a friend of the CEA) ($6 or less depending on format)  – This e-book is specifically geared toward New Englanders. It details a variety of energy efficiency projects that renters and homeowners can undertake and offers well-researched savings estimates.

These are just a few of many resources available to help you cut down on energy costs. You can see our interactive home map for a basic introduction to elements in the home that affect energy costs. And you can schedule a FREE home energy audit to see what improvements would benefit you the most. (Did we mention that it’s free? It’s also really easy.)

So, sit down with a cup of coffee, arm yourself with some information, and then dive in to an energy efficiency project!


Electric Vehicle Charging Comes to Cambridge!

Due to a grant the City of Cambridge recently received from the Massachusetts Department of Energy Resources, owners of  Electric Vehicles (EVs) will soon have the option of charging at public stations throughout the city. Only awarded to 24 other communities in the Commonwealth, this advance in the City’s Climate Protection strategy will encourage Cambridge drivers to make the leap from the common and inefficient Internal Combustion Vehicles (ICVs) to EVs and/or plug-in hybrids.

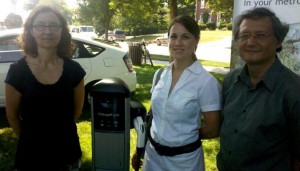
Susanne Rasmussen, Bronwyn Cooke, and John Bolduc at the DOER grant award ceremony.

Electric vehicles have been known as eco-friendly products for years; long enough that they seem to have become an integrated part of our society. EVs and plug-in hybrid cars use electricity, which is still mostly sapped from the grid; made through the burning of coal in large power plants. What many do not know is that the burning of fossil fuels in power plants is considerably more efficient than the incineration of gasoline in the ICVs that we are all used to.

From a first look, there seems to be no barrier to purchasing an electric vehicle other than maybe lack of familiarity for some, and otherwise cost–but in reality, at least one inconvenience stands in the way for some: Charging.

Until now, EVs have required drivers to charge at home or at private charging stations.  While Massachusetts does provide a $2,000 incentive for home charging station equipment, a need to charge outside the home pervades.

When all is said and done there will be at least seven new stations in Cambridge, provided through a public-private partnership between Coulomb Technologies and the State of Massachusetts. Right now the stations are still being set up and agreed upon by partners with the City, but you can be sure that you’ll be able to charge in Porter Square, at the Cambridgeside Galleria, and in the DPW lot near Inman Square before long.  Hours of availability, pricing, and more exact locations will come out as they are locked down!

Keep an eye on Coulomb’s ChargePoint station finder as they start popping up in Cambridge, and use the locator to find nearby stations in the meantime.

Energy Efficiency Job Opportunity: Part-time Executive Director

Are you looking for a job promoting energy efficiency locally? HEET (Home Energy Efficiency Team) is an award-winning nonprofit that fights climate change through teaching hands-on practical skills in energy efficiency while performing “energy upgrades” in the buildings of nonprofits. HEET also implements other energy-efficiency and renewable-energy programs in the greater Boston area. HEET is hiring an Executive Director to raise funds, manage staff, report directly to the Board of Directors.

Check out the full job announcement: http://www.heetma.com/content/seeking-part-time-executive-director

Getting to Net Zero: A Panel Discussion

The City is building a new “Net Zero” Martin Luther King Jr. School. There is a “Net Zero” petition before the Planning Board that would require that all new buildings in the city be “Net Zero”. The City Council will discuss the issue of “Net Zero” in a special Roundtable Meeting on October 10.

What does it all mean? Come find out at this panel discussion of experts hosted by Mayor Henrietta Davis.

Moderator: Henry Lee, John F. Kennedy School of Government, Harvard University.

Panelists:
•Jane Carbone, LEED AP of Homeowner’s Rehab. Inc., Cambridge, MA
•Rob Diemer, Architectural Engineer, LEED AP of In Posse LLC., Philadelphia, PA
•Eric Friedman, Green Communities Division, Massachusetts Department of Energy Resources
•Stephen Turner, LEED AP, Commissioning Expert, Stephen Turner, Inc., Providence, RI
•Jana Silsby, AIA, LEED AP, Perkins Eastman, Boston, MA

RSVP by emailing: mayor@cambridgema.gov

Where: Cambridge Public Library – 449 Broadway, Cambridge, MA, 02138

When: Wednesday, October 2nd from 6pm to 7:30pm

Massachusetts Still #1 in Energy Efficiency

Earlier this month, the American Council for an Energy Efficient Economy (ACEEE) released its 2012 State Energy Efficiency Scorecard. The organization releases this state-by-state comparison of policies every year, and for the second year in a row, Massachusetts has clinched the top spot. According to ACEEE: “The report examines six of the primary policy areas in which states typically pursue energy efficiency: utility and ‘public benefits’ programs and policies; transportation policies; building energy codes; combined heat and power (CHP) policies; state government-led initiatives around energy efficiency; and appliance and equipment standards.” Massachusetts’ success is due largely to the Green Communities Act, passed in 2008, which requires ongoing efforts from utilities to be more efficient each year. The law also established the Green Communities program, which encourages cities and towns to carry out sustainability efforts in order to receive grant funding and other benefits. Cambridge has been a Green Community since May 2010 and has received over $600,000 in both designated and competitive grants to improve the efficiency of a number of city-owned buildings and sites.

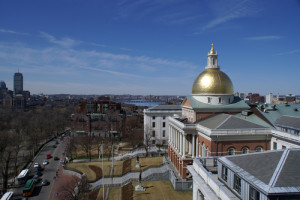
State House in Boston

Massachusetts State House

This year, for the first time, ACEEE also ranked 34 of America’s most populous cities according to their energy efficiency policies and performance. Although Cambridge was not included in the study, Boston claimed the #1 spot on the list. The calculations included local government operations, transportation policies, energy and water utilities and public benefits programs, buildings policies, and community-wide initiatives. Boston achieved its superiority through its Renew Boston program, which provides free energy assessments to homeowners and small businesses and low-cost upgrades, its efficient building codes, and concrete targets for reducing energy use.

All this good news goes to show that our state and local leaders are on the right track when it comes to energy efficiency at all levels- from large utilities down to single family homes and rental units. This kind of success is only possible through collaboration between different levels of government as well as partnerships between government and the private sector. Of course, we still have a lot of work to do. Many of our old and historic homes need upgrading, our public transportation system is aging, and the state needs to set more efficiency standards for many of the appliances we all use on a daily basis. Now that we’ve achieved #1 status in the country, let’s use the momentum and grow our reputation as a leader on this issue.


Give the Gift of Energy Efficiency this Holiday Season

Shopping for friends and family during the holidays can be stressful, and sometimes it’s hard to think of something your recipient will really use and enjoy. With this gift guide, that won’t be an issue. There’s something for everyone- from the energy novice to the efficiency aficionado. And these gifts will keep on giving, as your loved ones save money again and again on their energy bills!

  • The Belkin “Conserve” power strip is for that person who leaves everything plugged in, all the time.  Their electronics are sucking up energy even when not in use. The Master Outlet (green) detects when your TV is on or off and controls power to five controlled outlets (grey) for DVD players, VCRs, etc. Two uncontrolled outlets (black) give continuous power for items like cable boxes or phone chargers.


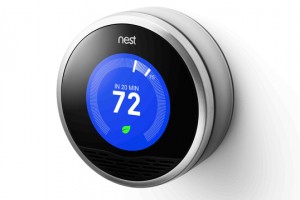
  • The Nest smart thermostat is the latest thing in home heating and cooling. Developed by former Apple and Google innovators, its smart and sleek aesthetic mirrors how intelligently it learns your heating and cooling preferences. Nest learns your schedule, programs itself and can be controlled from your phone.


  • The “Nest” is on the pricier end of smart thermostats. If you don’t feel like splurging, there are more affordable options out there, like this one from Hunter.
  • Under-the-door draft stoppers, like this snowman themed one, are both decorative and functional. Lots of different styles come up with a simple Google search.
  • Energy Star products are always a green choice when gifting someone a DVD player, sound system, etc. In order for a machine to qualify, it must use less energy during all phases (on, sleep, and off) than non-certified products.
  • CFL bulbs and LED bulbs are a great gift for those hold-outs on your list who are still using incandescent bulbs (and paying for it with higher electric bills).
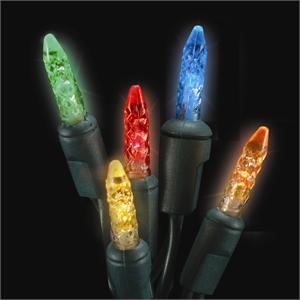
  • Does someone you know love to decorate their home or yard with strings of blinking lights? Those can hike up your energy bill, especially if they’re on all season long. LED holiday lights use much less energy and are just as festive.


Or, give to a worthy organization in someone’s name. Here are a few:

Home Energy Efficiency Team (HEET)

 Interfaith Power & Light

 New Generation Energy

Have a safe, happy, and energy efficient holiday!