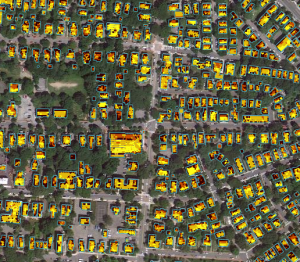
 In collaboration with MIT and Modern Development Studio, the City of Cambridge has put together an incredible online tool that will help spur solar development throughout the city.
In this “solar map,” to be launched on October 3rd, Cambridge has been overlaid with a layer of highly specific solar data. Any resident or business owner interested in installing solar on their roof can use the map to access information about their property’s potential without having to scour the Internet. You can click and drag your mouse, browse and choose rooftops at random. Alternatively you can search for a specific address and view information on the solar potential of the building’s rooftop, as well as financial, environmental, and installation details. Color-coding gives you an idea of the varying ability to catch decent sun rays at each point on a roof.
I was able to find out within seconds that my own building, for example, has a total roof area of 1,150 square feet and enough potential to host a 5-kilowatt system. The system would have a payback period of six years and could save the tenants approximately $2,847 per year in energy bills. That’s pretty convincing math. Now, if only my landlord were keen on the idea!
New York City, Boston, Los Angeles, San Fransisco, and Berkeley, CA all have solar maps up and running or in progress. Although some existing solar maps also calculate solar potential, none are quite like Cambridge’s. It is so far unique in that it uses more nuanced data to create as much accuracy as possible. For example, some solar maps assume all rooftops are flat, which can greatly alter a roof’s potential. The map’s creators also calculated solar radiation on an hourly basis, yielding more accurate and detailed information for each roof.
It is becoming more and more popular- and feasible- to power your home with solar energy. Costs have come down exponentially and they are only declining. Cambridge already has a over 110 projects installed on homes and businesses, as many residents have taken advantage of the lower electricity costs, increased property value, and reduced environmental impact that comes with generating over 1.6 MW solar power. It’s clear that there is vast solar potential in Cambridge. This map will prove to be an invaluable tool for homeowners, landlords and business owners who are interested in investing in solar but might not have the time or expertise to find all the answers themselves.
SPECIAL EVENT Launching the Cambridge Solar Map: You’ve Got (Solar) Potential!
Wednesday, October 3, 2012
6:00 PM – 8:30 PM
Location:
Main Library
449 Broadway
Lecture Hall
What’s your building’s solar potential? Meet installers, hear from homeowners who have installed solar on their homes and learn from the Cambridge Energy Alliance about the resources available to you! Don’t take our word for it, listen to what the homeowners and scientists have to say. “When the numbers work in such a compelling way, it’s almost hard not to install solar,” said David Neiman, Cambridge homeowner.
Professor Christoph Reinhart of MIT will speak about the science behind the NEW Solar Map. “MIT and MoDe Studio have installed an online tool that predicts electricity yield and costs for installing a photovoltaic system on almost any rooftop in Cambridge. What’s YOUR solar potential?”
