About JPierce

Jerrad is a environmental policy person, and watches a lot of PBS.

Everything’s ACES

Aces Still wondering just what ACES a.k.a Waxman-Markley, or “The Climate Bill,” is all about? Perhaps this brief interview with the president of the Alliance to Save Energy will help. Of course, then there’s the question of whether it’s too little too late, too much too soon, or just right? Bill Moyers’ guests this week say it’s not enough. I tend to agree, though I’m not entirely convinced it’s the false start they’d have us believe. Regardless, the summary of Waxman-Markley’s measures seems fairly moderate. Indeed, the building code changes it calls for are only slightly higher than future federal regulations!

P.S. GovTrack has some interesting tools to let you monitor the progress of bills like ACES.

Think Global, Act Local

Think global A report by the British Carbon Disclosure Project suggests that there is merit to this progressive witticism maxim. The study reviewed the efforts of 18 American cities which are members of ICLEI: Local Governments for Sustainability, and found that in recent years cities have begun to undertake planning and mitigation efforts in earnest with positive effects.

A summary is available, as well as a PDF of the full report. The takeaway message is reminiscent of a recent paper by David Satterthwaite, in which he proposes that cities are the solution, not the problem. More evidence that the efforts of ICLEI’s ~1,100 members (from Albuquerque to Zagreb), and the ~1,000 signatories1 to the U.S. Conference of Mayors climate protection agreement (from Anchorage to Yonkers are well placed.

1. Interestingly, nearly half of ICLEI members are in the United States, and two thirds of those are also members of the conference, meaning there are 700 municipalities which are only members of the latter.

Mind the gap.

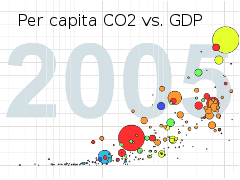
Bubble chart of CO2 emission per capita vs. GDP Gapminder is an organization dedicated to helping understand the world, and particularly environmental issues, by providing interesting tools for statistical analysis. They’re well-known for their Wonderbread-like bubble charts, and brief presentations by director Hans Rosling like the one at right on CO2 emissions from their “myth demolishing series.”

See also Worldmapper.

IRENA, soon to be a household name?

In case you missed it last week, among all the pop-culture news coverage and myriad other events, the U.S. has joined a majority of the world’s countries as a member of IRENA. The new International Renewable ENergy Agency. After reading their FAQ I still wasn’t entirely sure what they expected to do, but their press packet was a little more enlightening:

The Agency’s tasks will include, among others,
• working with its member states to improve the policy environment for the use of renewable energy,
• engaging in cooperation on technology transfer issues in the area of renewable energy, and
• supporting capacity building measures in the field of renewable energy.

The Agency will advise its member states using an integrated, practice-oriented approach that takes account of country-specific circumstances. To that end, IRENA will pursue specific activities:
• policy advice,
• advice on financing and technology issues, and
• processing and provision of information, including reliable scientific data.

Sounds swell, and I hope that I’m not reading between the lines too much because it sounds like IRENA could actually seek some desperately needed patent reform. The existing system is a mess, and is regarded by many to hinder rather than help progress of the technical arts as the founding fathers initially intended. For instance, last week the Wall Street Journal carried an article about Toyota’s immense Prius patent portfolio, and its impact on the competition.

Whiche’er way the wind blows

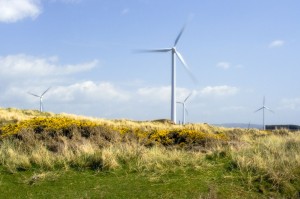
Photo of wind turbine in field

Remember T. Boone Pickens and his famous plan? There’s been much buzz today (for example) about an announcement of the downward revision of his original plans to one quarter the original scale. The change has been attributed to lower fossil fuel prices than when the plan was first put forth, as well as the credit crunch. However, Pickens is already on the hook for nearly 700 turbines, and he plans to make several smaller wind farms rather than the megafarm previously proposed. Most people seem to see this as an unfortunate turn of events, but a handful of smaller installations are a more sound strategy from most vantage points e.g; redundancy, minimizing impacts, etc. As for the diminished capacity, initial delivery is not due until 2011, so it there’s probably still time for things to pick back up.

(Update)

Small roof-top wind turbine installation in Harvard Square

P.S. There seems to be a new wind installation in Harvard Square next to The Garage at Dunster & Mount Auburn. Give it a gander next time you’re in the area, and if you forget but it’s gusty out, you might just look up to figure out where that gentle whirr is coming from. (Click the image at right for a better view)

TechTV

logo-mit-techtv

If you’ve got time and bandwidth to kill, you might want to check out TechTV. In the spirit of OpenCourseWare, MIT hosts videos of various guest lectures and conferences. For instance, Energy forecast for the rest of the century. Although I don’t personally agree with all of the professor’s interpretations—many conflict with the more pragmatic views portrayed in “Sustainable Energy,” which is incidentally available via OCW—it was an interesting presentation, and could probably serve as a good introduction for the uninitiated nevertheless. I also appreciated his putting the scope of human influence in perspective by comparing it with natural flows. It reminded me of prolific environmental author Vaclav Smil’s excellent Cycles of Life : Civilization and the Biosphere.

Ghouls & Gallons

Here’s an interesting graphic showing the amount of energy consumed by some common appliances when not in use, although the distinction between “passive” and “active” loads also seems unnecessary and distracting. Also, this phenomenon is typically called phantom load not “vampire load,” as the artist has dubbed it, after a less common term for wall-warts. Perhaps this even inspired google’s little contribution towards energy frugality last Halloween: The Haunted House? In any event, be sure to multiply the listed costs of these little suckers by a factor of 2 or 3 to to more accurately reflect bills in Cambridge.

Activity Water Options

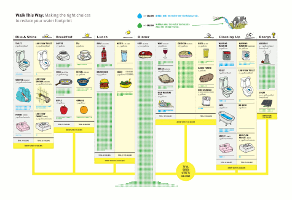
Also while surfing this weekend I came across another infographic from progressive magazine GOOD. This one’s a sort of decision tree, comparing water consumption for daily activities. Keep in mind though, that things are not quite as simple as some would like to make them out to be. While it may actually take more water to grow an apple, the devil is in the details. If you’re biting into a Jonagold from Stow in September, then much of the water was rain, and very little gasoline went into transporting it. On the other hand, an orange from a field irrigated with scarce water in California or Florida has a lot of embodied energy. As always caveat emptor.

The Case for Efficiency…

…in pretty graphic form: More abundant and cheaper than the alternatives.

Comparison of electricity generation methods

While cleaning out my bookmarks this past weekend—afterall, a little spring cleaning was in order since I’ve collected tens of thousands of links in the past decade on topics ranging from unconventional toilet tank retrofits to a still-useful subway map that predates the MBTA trip planner—I rediscovered these slightly dated but insightful graphs comparing different technologies for furnishing additional electric power. Unfortunately, it does not include figures for my pet mode of generation: Extraplanetary Solar Power.